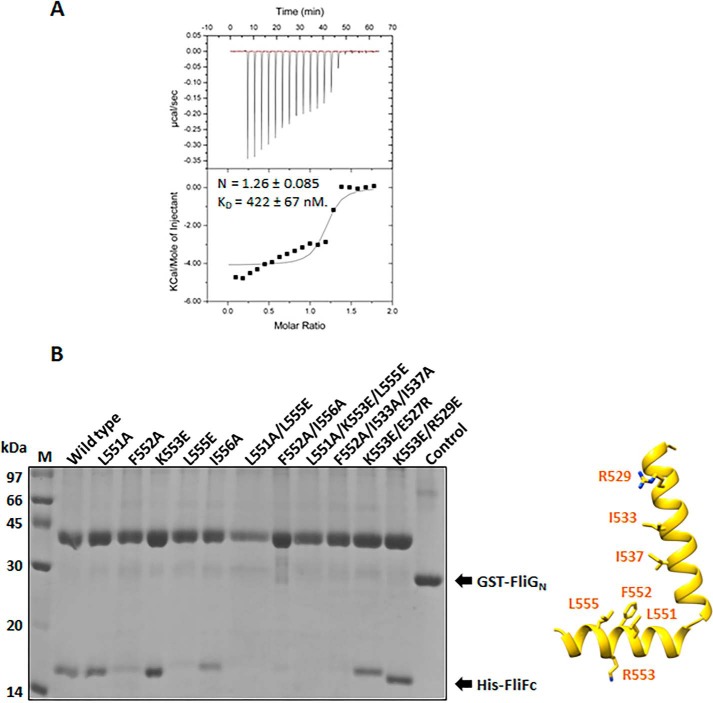
Figure 3.
Characterization of the FliF–FliG interaction from H. pylori. A, isothermal calorimetric titration (ITC) of FliGN with FliFC. The ITC experiment was performed by titrating 480 μm FliFC into 50 μm FliGN. The data were analyzed and the thermodynamic parameters were obtained using Origin software. The heats were integrated and fit into a single binding site model. Values are expressed as mean ± S.D. and were calculated from three independent experiments: n = 1.26 ± 0.085, KD = 422 ± 67 nm. B, the molecular interaction of FliFC–FliGN using a pulldown assay. Different His-tagged FliF variants were individually co-expressed with GST-tagged FliGN in E. coli. The clear cell lysate was immobilized on the glutathione Sepharose. After washing, the formation of the FliFC–FliGN complex was examined by SDS-PAGE. The control experiment using GST co-expressed with FliF was set. The location of the mutation sites on FliF are indicated by sticks in the structure (left).

