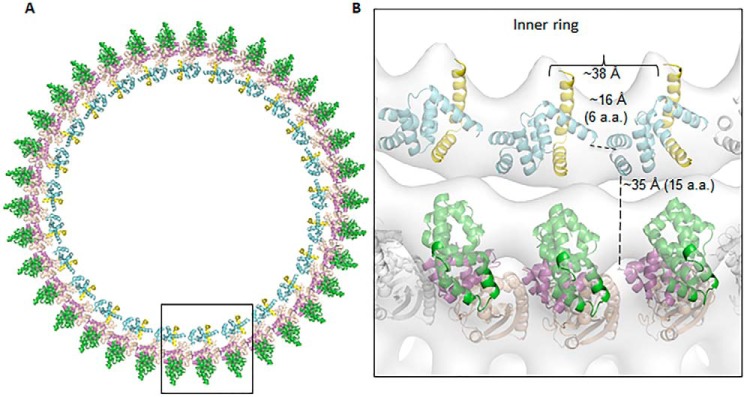
Figure 8.
The proposed assembly model of FliFC–FliG in the MS–C ring complex. A, a single FliGN–FliF was manually docked to a low-resolution cryo-EM map from S. typhimurium and further optimized by the Fit to Map program in Chimera (25). The center of mass for the single complex was calculated, which had a distance of 167 Å from the center of map. The value was taken as the radius of the ring density and used for calculating the circumference of the ring. The rest of the molecules were generated by translation along the circumference of the ring to generate a 25-fold symmetry. The ring model was further fit into the EM map with a correlation coefficient of 0.84 at 30 Å. The outer ring model was generated by docking 34 molecules of the H. pylori FliGMC (PDB ID: 3USW) to the density map with a correlation coefficient of 0.76 (15). B, zoomed-in view of three FliFC–FliG units. The distances between the Cα of Asn78 and Gly85 linking helix 5 to helix 6 and between Lys111 and Ala126 connecting FliGN to FliGM are shown. The distance between the center of mass of the adjacent FliFC–FliGN model is also indicated.

