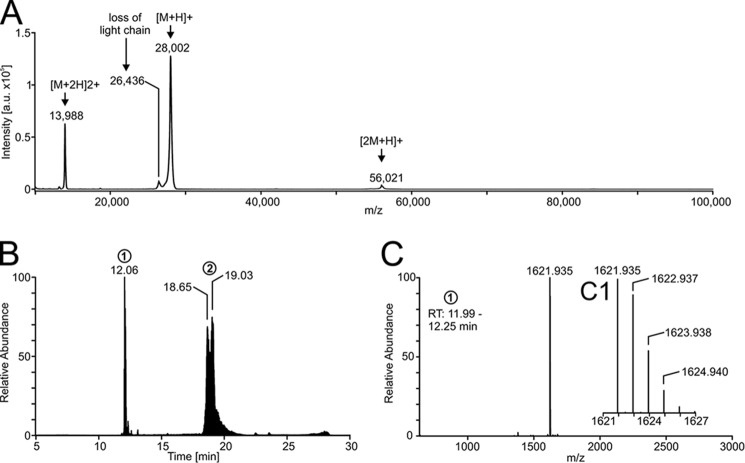
Figure 2.
Mass spectrometry of the PQM protease. A, mass spectrum of the intact protein acquired by MALDI-TOF-MS. The matrix used was α-cyano-4-hydroxycinnamic acid. B, chromatogram of the reduced and alkylated isolated protease given as total ion current. The heterodimerity of the protease is shown by separation of the light chain (peak 1) and the heavy chain (peak 2). C, mass spectrum of the light chain (retention time 11.99–12.25 min) with insertion (C1) showing the enlargement of the region at 1621–1627 m/z. The mass spectrum was deconvoluted to neutral monoisotopic masses with Xcalibur version 2.2 and its plug-in Xtract.

