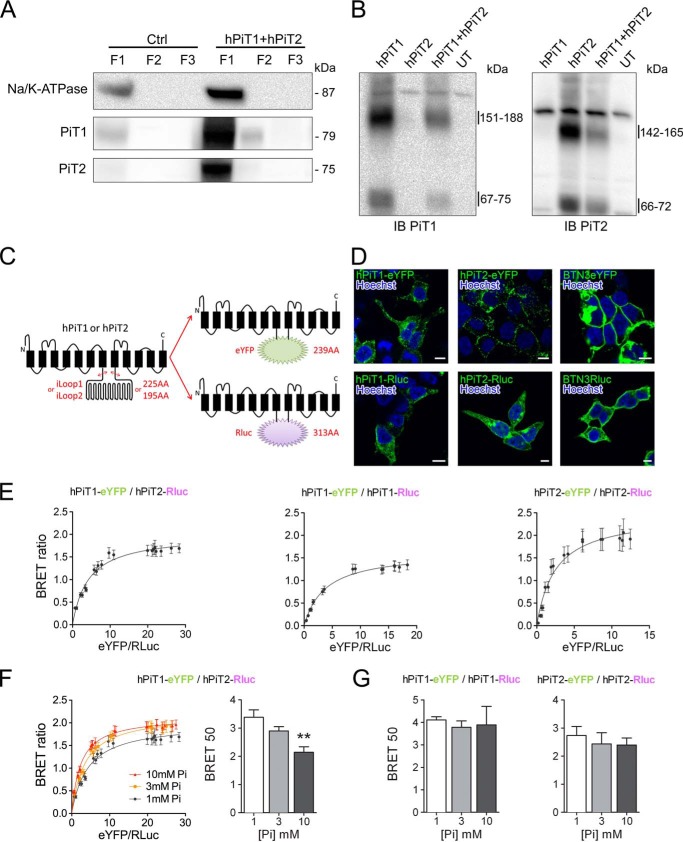
Figure 3.
Specific interaction between PiT1 and PiT2 varies upon extracellular Pi concentration. A, Western blotting analysis of Na/K-ATPase, hPiT1, and hPiT2 expression in pmaxGFP-transfected (Ctrl) or hPiT1 and hPiT2 co-transfected HEK293T cells after crude cellular fractionation, as indicated (see “Experimental procedures” for details). Overexpression of hPiT1 and PiT2 allowed a better signal than Ctrl. B, Western blotting analysis (IB) of hPiT1 (left) and hPiT2 (right) expression in HEK293T cells untransfected (UT) or transfected with hPiT1, hPiT2, or both after cell surface cross-linking using bis(sulfosuccinimidyl)suberate and cellular fractionation. Enriched plasma membrane fraction (F1) was analyzed. C, schematic representation of chimeric hPiT1-eYFP or -Rluc and hPiT2-eYFP or -Rluc proteins used for BRET assays. The DNA region encoding for the large internal loop of PiT1 and PiT2 (iLoop1 and iLoop2, respectively) was replaced by coding sequences of eYFP or Rluc. Transmembrane domains (black rectangles) are shown. D, confocal images obtained from transfected HEK293T cells, as indicated. Rluc was detected after immunofluorescence and nuclei were stained using Hoechst (blue). Scale bar, 10 μm. E, representative BRET saturation curves of co-transfected HEK293T cells, as indicated. F, representative BRET saturation curves (left panel) and BRET 50 index (right panel) of HEK293T co-transfected with hPiT1-eYFP and hPiT2-Rluc obtained following a 10-min incubation with 1, 3, or 10 mm extracellular Pi concentration, as indicated. BRET 50 data are means ± S.E. (error bars) (**, p < 0.01 versus 1 mm Pi condition, n = 8). G, the BRET 50 index was measured from BRET saturation curves obtained from HEK293T co-transfected with hPiT1-eYFP and hPiT1-Rluc (left) or hPiT2-eYFP and hPiT2-Rluc (right) following a 10-min incubation with 1, 3, or 10 mm extracellular Pi concentration. BRET 50 data are means ± S.E., and no statistically difference was observed (n = 4–8).

