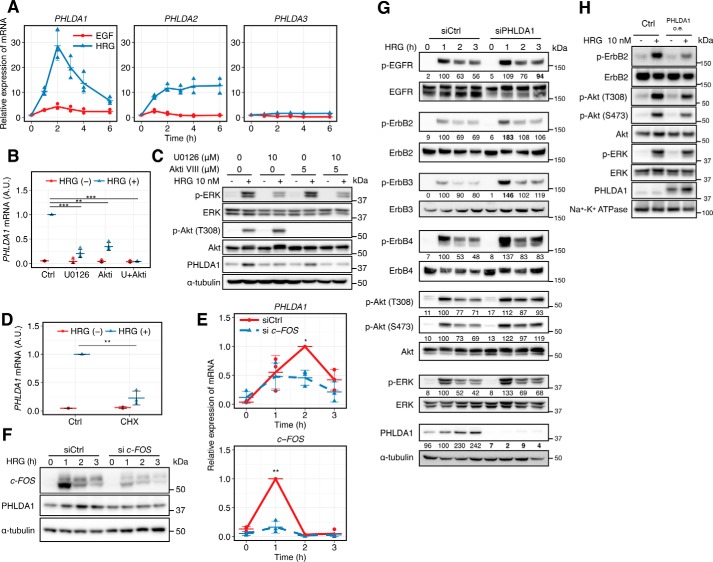
Figure 1.
PHLDA1 inhibits the ErbB receptor pathway. A, time course of relative amounts of PHLDA gene family transcripts in ligand-stimulated MCF-7 cells. The blue line shows the cells stimulated with HRG, and the red line shows stimulation with EGF. Data were normalized so that the non-stimulated condition is designated as 1. B, effect of U0126 (10 μm) and Akt inhibitor VIII (5 μm) on PHLDA1 induction at 2 h after HRG stimulation. Data were normalized so that the HRG-stimulated condition is designated as 1. C, effect of U0126 (10 μm) and Akt inhibitor VIII (5 μm) on PHLDA1 protein induction at 3 h after HRG stimulation. The blotting-determined PHLDA1 levels are shown in Fig. S2. D, effect of cycloheximide (CHX) (10 μg/ml) on PHLDA1 mRNA induction at 2 h after HRG stimulation. Data normalization was done the same way as in B. Ctrl, control. E and F, effect of c-FOS siRNA on PHLDA1 mRNA (E) and protein (F) expression levels. E, data were normalized so that the highest value in all conditions is designated as 1. G, effect of PHLDA1 knockdown on ErbB receptor signaling. After transfection of PHLDA1 or control siRNA, MCF-7 cells were stimulated with 10 nm HRG for the indicated time periods and subjected to Western blotting. The digital values were annotated under each lane. The band intensities of phosphorylated proteins were quantified by dividing the total protein, and the band intensities of PHLDA1 were quantified by dividing α-tubulin. Then the values were normalized so that the value of the siCtrl sample with HRG treatment for 1 h is designated as 100. The values that have statistical significance are presented in boldface. H, effect of PHLDA1 overexpression on the plasma membrane fraction. After vector transfection, MCF-7 cells were stimulated with 10 nm HRG for 5 min. A, B, D, and E, each point represents the results of an independent experiment; colored bars indicate the average value of all experiments, and error bars denote standard deviation (S.D.) calculated from biological independent experiments (n = 3). The digital values of the band intensities in F, G, and H are shown in Fig. S3–S5, respectively. Data in B, D, and E, two-tailed Welch's test: *, p < 0.05; **, p < 0.01; ***, p < 0.001. A.U. indicates relative expression value of PHLDA1 mRNA in B and D.

