Figure 2.
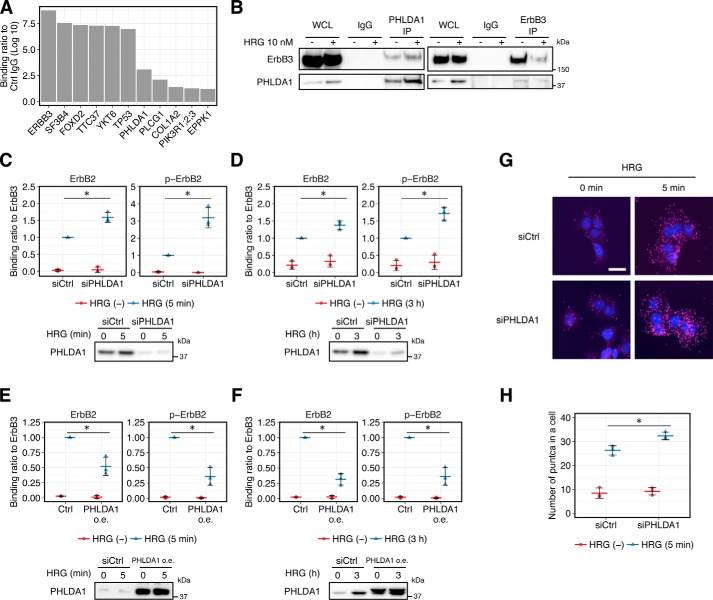
Effect of PHLDA1 on ErbB receptor activation. A, binding score of the proteins that were co-immunoprecipitated with PHLDA1 antibody in HRG-stimulated MCF-7 cells. Proteins co-IP with the anti-PHLDA1 antibody were identified by LC/MS analysis. The indicated values are the log10-transformed ratio of the LFQ intensities of PHDLA1-IP over the negative control mouse IgG. The proteins with less than 1 (log10 ratio) are not shown. The graph is a representative of two experiments. B, co-IP experiment with PHLDA1 antibody or ErbB3 antibody (sc-7390). WCL, whole-cell lysate. C and D, top, effect of PHLDA1 knockdown on the physical interaction between ErbB3 and phosphorylated ErbB2 or ErbB2 at 5 min (C) or 3 h (D) after 10 nm HRG stimulation. Bottom, blot confirming the knockdown of PHLDA1. E and F, top, effect of PHLDA1 overexpression on the physical interaction between ErbB3 and phosphorylated ErbB2 or ErbB2 at 5 min (E) or 3 h (F) after 10 nm HRG stimulation. Bottom, blot confirming the overexpression of PHLDA1. oe, overexpression. C, D, E, and F, graphs show the relative intensities of the phospho-ErbB2 or ErbB2 bands divided by that of total ErbB3. Data were normalized so that the value of the HRG-stimulated control (Ctrl) condition is designated as 1, n = 3. Each point represents the result of an independent experiment, and colored bars indicate the average value of all experiments and error bars denote S.D. Two-tailed Welch's test: *, p < 0.05. Representative raw blotting data are shown in Fig. S7. G, effect of PHLDA1 knockdown on hetero-oligomerization between phospho-ErbB2 and ErbB3 by PLA. DAPI staining is in blue and magenta puncta represent individual oligomers. Scale bar, 30 μm. H, quantification of magenta puncta per cell in the PLA. Each point represents the result of an independent experiment, and colored bars indicate average values of all experiments, and error bars denote S.D. Two-tailed Welch's test: *, p < 0.05.

