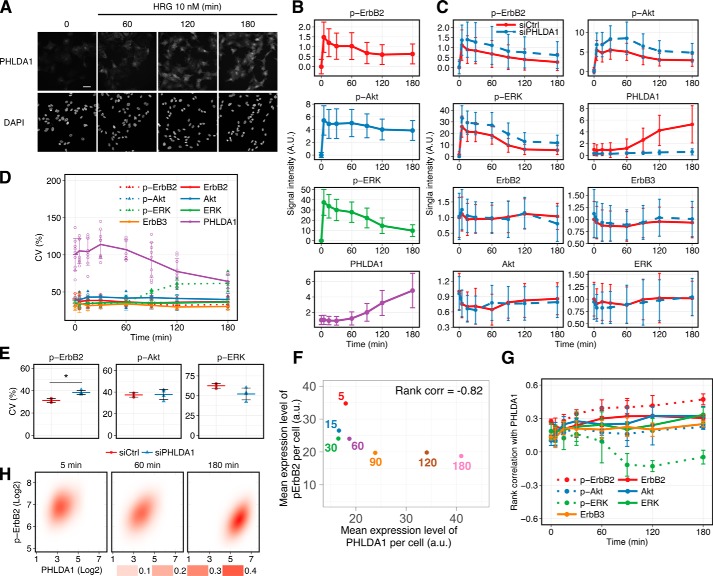
Figure 3.
HRG-induced PHLDA1 expression and ErbB phosphorylation were determined by using imaging cytometry. A, immunostaining of PHLDA1 in MCF-7 cells. Cells were treated with/without 10 nm HRG. Top, PHLDA1; bottom, DAPI. White scale bar, 50 μm. B, time-course pattern of PHLDA1 expression and phosphorylation of ErbB2, ERK, and Akt. The graphs represent the average dynamics of single-cell measurements. Error bars denote S.D. of signal intensities in a single cell. Similar results obtained by Western blotting are shown in Fig. S8. C, PHLDA1 knockdown experiments using an imaging cytometer. The graphs represent the average dynamics of single-cell measurements in control and knockdown conditions. Error bars denote S.D. of signal intensities in a single cell. D, coefficient of variation at each time point was calculated from the results of single-cell imaging. Error bars denote S.D. from at least three independent experimental values. E, effect of PHLDA1 knockdown on the CV of ErbB signaling at 180 min after HRG stimulation. Each point indicates the result of an independent experiment, and colored bars indicate the average value of all experiments. Error bars denote S.D., n = 4. Two-tailed Welch's test: *, p = 1.3 × 10⁻³. F, relationship between PHLDA1 and phospho-ErbB2 in single-cell measurement experiments. Mean expression levels of both proteins were calculated from experimental data (details are described under “Mean expression level per cell” under “Experimental procedures”). The numbers represent time points. Spearman's rank correlation coefficient was −0.82. G, rank correlation coefficient at each time point was calculated from the results of single-cell imaging. Error bars indicate S.D. of at least three independent experiments. H, 2D probabilistic density of phospho-ErbB2 and PHLDA1 in a cell population stimulated with 10 nm HRG. Each panel contains at least 1500 cells. B and C, method for data normalization is described in detail under “Experimental procedures.” A.U. indicates relative signal intensity.

