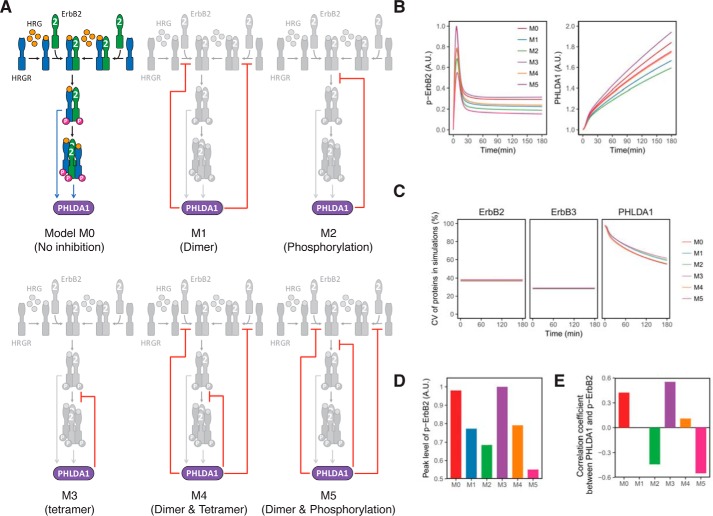
Figure 4.
Simple mathematical models of the activation of ErbB receptors. A, six models describing the inhibitory function of PHLDA1 on ErbB receptor activation. B, computational simulation of phospho-ErbB2 and PHLDA1 in each model. The graphs represent the average dynamics of 10,000 simulations. The colored lines correspond to the six models shown in A. A.U. indicates relative signal intensity of p-ErbB2 (left) and relative abundance of PHLDA1. C, time-course pattern of CVs of total ErbB2, total ErbB3, and PHLDA1 in each simulation model. D, peak intensities of phospho-ErbB2 in each model. A.U. indicates relative peak intensity of p-ErbB2. E, rank correlation between phospho-ErbB2 and PHLDA1 in each model at 180 min after HRG stimulation.

