Figure 5.
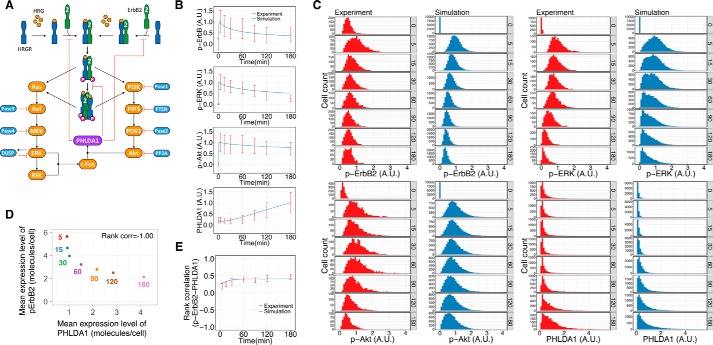
Mathematical simulation considering PHLDA1 and experiments of HRG-induced ErbB receptor signaling including PHLDA1. A, mathematical model of the ErbB-PHLDA1 network. Details of the model construction are described in the supporting information. B, time-course kinetics of phospho-ErbB2, phospho-Akt, phospho-ERK, and PHLDA1 expression after treatment of MCF-7 cells with 10 nm HRG. Red plots represent average signal intensity detected experimentally by imaging cytometry (shown in Fig. 3B). Blue lines represent averaged dynamics of each species in the simulation results. Each time-course plot is normalized so that the maximum value is designated as 1. Top, A.U. indicates relative signal intensity of p-ErbB2; 2nd from top, A.U. indicates relative signal intensity of p-ERK; 3rd from top, A.U. indicates relative signal intensity of p-Akt; bottom, A.U. indicates relative abundance of PHLDA1. C, time-series histogram of phospho-ErbB2, phospho-Akt, phospho-ERK, and PHLDA1 in a cell population stimulated with 10 nm HRG (red, single-cell experiment by imaging cytometry; blue, 10,000 times of simulation). Each plot is normalized so that the maximum of average signal intensity of a cell population in the time-course is designated as 1. Upper panel from left to right: A.U. indicates relative signal intensity of p-ErbB2 in 1st and 2nd panels and indicates relative signal intensity of p-ERK in 3rd and 4th panels. Lower panel from left to right: A.U. indicates relative signal intensity of p-Akt in 1st and 2nd panels and indicates relative abundance of PHLDA1 in 3rd and 4th panels. D, relationship between PHLDA1 and pErbB2 in the simulation. Mean expression levels of both proteins were calculated from simulation results (details are described under “Mean expression level per cell under the “Experimental procedures”). The numbers represent time points. Spearman's rank correlation coefficient was −1.00. E, time-course patterns of rank correlation between phospho-ErbB2 and PHLDA1 (red, experiment; blue, simulation). Error bars denote S.D., n = 3.

