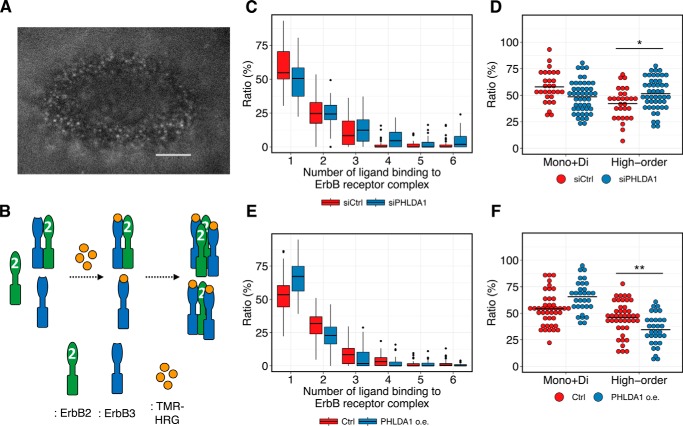
Figure 6.
Single-molecule imaging of TMR-HRG on the cell surface of MCF-7 cells. A, representative image of single-molecule imaging. Scale bar, 5 μm. B, illustration of interpretation of the results of single-molecule imaging. C–F, box plots of the ratio of ErbB higher-order oligomers affected by PHLDA1 knockdown (C) and overexpression (E). Summarized plots generated from the same data are shown in D and F, respectively. Each point indicates a result in a single cell. Black horizontal lines indicate the mean value of each condition. Two-tailed Welch's test was performed: *, p = 9.7 × 10⁻³; **, p = 2.2 × 10⁻³.

