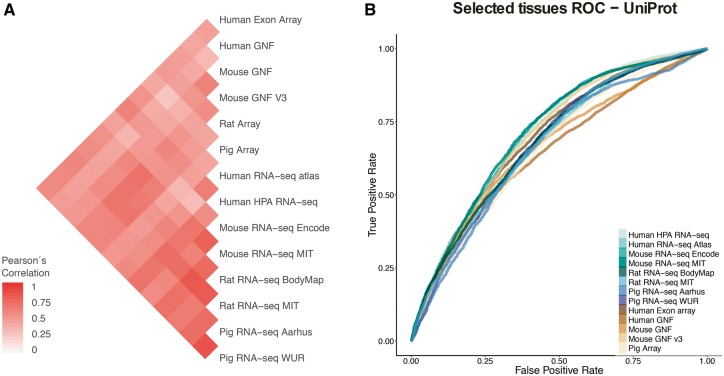
Figure 4.
(A) Pearson’s correlation coefficients between final confidence scores of gene–tissue associations across datasets. For each pair of datasets, we considered the set of common genes (genes being expressed in at least one tissue in each dataset), and common tissues between the two datasets. (B) In this panel, we compare the rates of True positives and False positives for each dataset for the common tissues to show that the correlation between datasets is mainly influenced by quality rather than by organism or technology.

