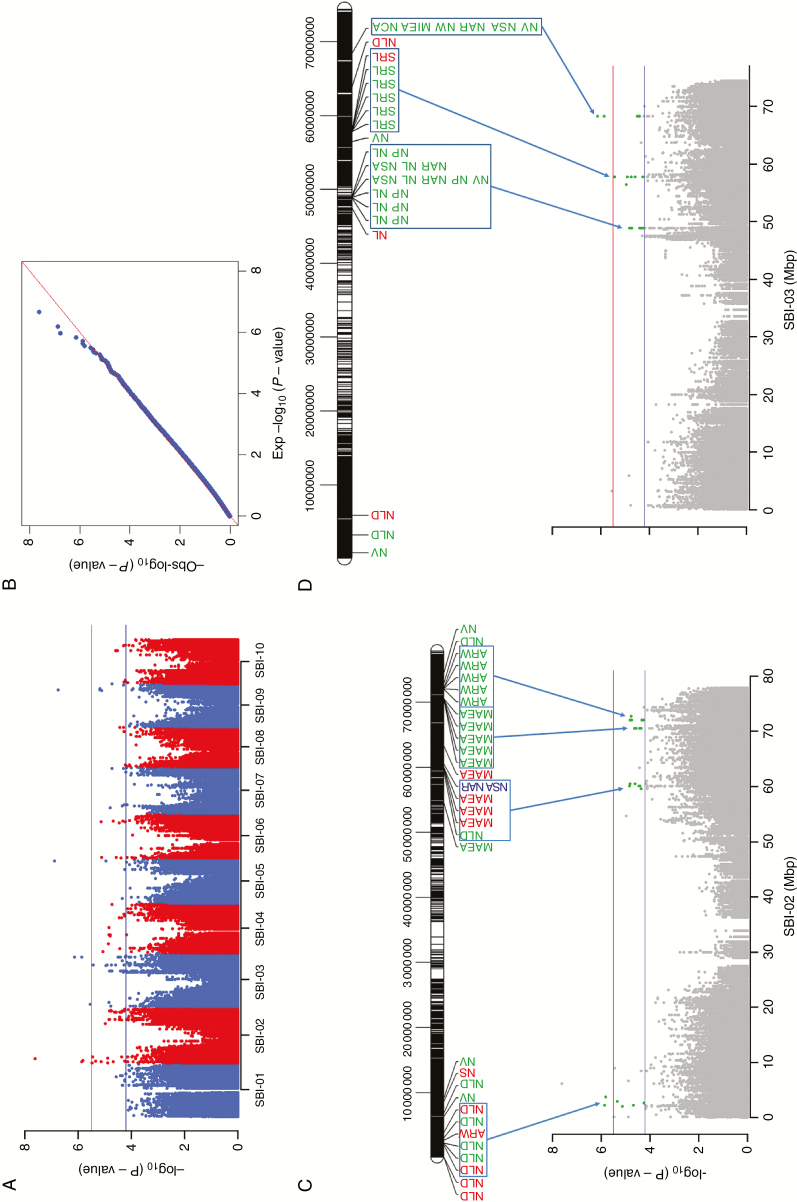
Fig. 5.
(A) Manhattan plot showing P-values and suggestive and significant marker–trait associations for all traits. Horizontal red and blue lines indicate thresholds for significant marker–trait associations after Bonferroni correction (P < 2.9 × 10⁻⁶) and suggestive associations (P < 5.7 × 10⁻⁵). (B) QQ plot. (C, D) QTL hotspots for the traits network length distribution (NLD), average root width (ARW), network volume (NV), network solidity (NS), major eclipse axis (MaEA), network surface area (NSA), network area (NAR), total root length (NL), network perimeter (NP), specific root length (SRL), minor eclipse axis (MiEA) and network convex area (NCA) on SBI-02 (C) and SBI-03 (D) at early development (blue), high (green) and low P (red).

