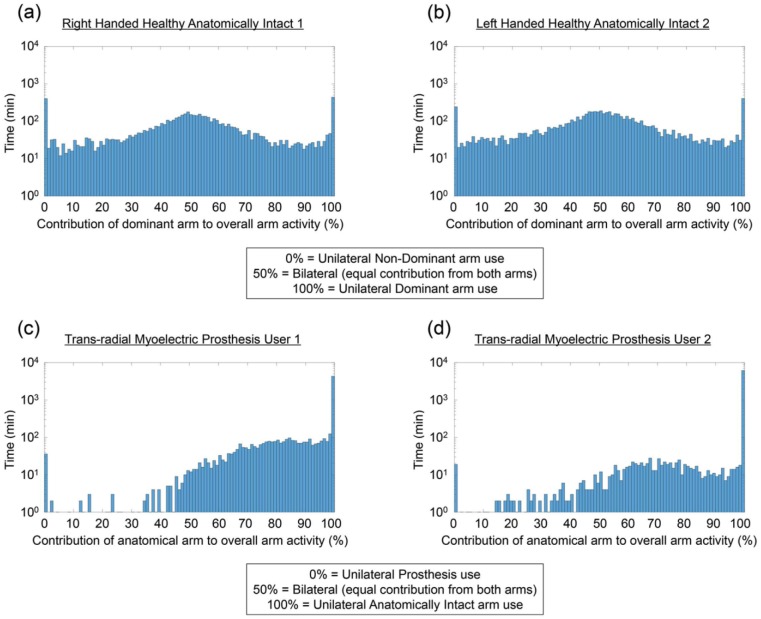
Figure 1.
Histograms representing the balance of activity across the upper limbs. (a, b) Data recorded for the two anatomically intact participants (1 and 2, respectively) and (c, d) data for the two prosthesis users. On the x-axis, the ratio of contribution to activity between the upper limbs is shown as a percentage. 100% indicates unilateral use of the dominant/anatomical limb, 50% indicates bilateral use of the arms and 0% indicates unilateral use of the non-dominant arm/prosthesis. The data have been grouped into 1% bins, and the y-axis shows the total time in minutes, plotted using a log10 scale. A log10 scale is used for ease of visualisation of the prosthesis user data considering the large amount of unilateral activity on the anatomical arm.

