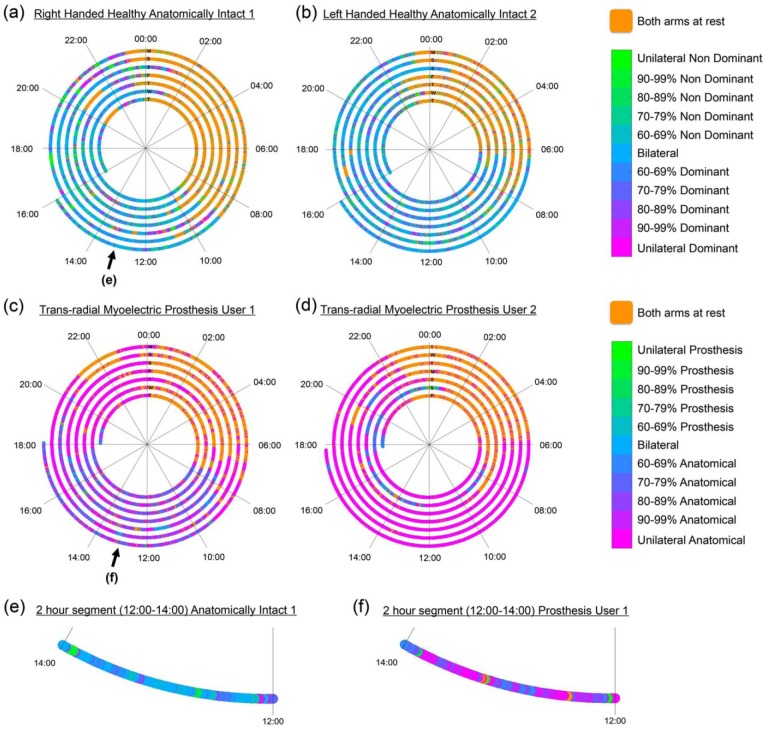
Figure 2.
Upper limb activity recorded from two wrist worn activity monitors. Each graph (a–d) represents data recorded over a 7-day period, with each ring representing 24 h. Progression of time is from the centre outwards. Each ring is labelled with a letter signifying the day of the week corresponding to the subsequent 24 h of data. The scale in the legend displays colours relating to the ratio of activity counts recorded on each monitor. (a) Right-handed healthy anatomically intact participant, (b) left-handed healthy anatomically intact participant, (c) myoelectric prosthesis user with congenital trans-radial limb absence on the right-hand side – Prosthesis User 1 (self-reports to be satisfied with prosthesis), (d) myoelectric prosthesis user with congenital trans-radial limb absence on the left-hand side – Prosthesis User 2 (self-reports to be dissatisfied with prosthesis). (e, f) Expanded views of the 2-h segment between 12:00 and 14:00 on the final day (Monday) for (e) anatomically intact participant 1 and (f) Prosthesis User 1.

