Figure 3.
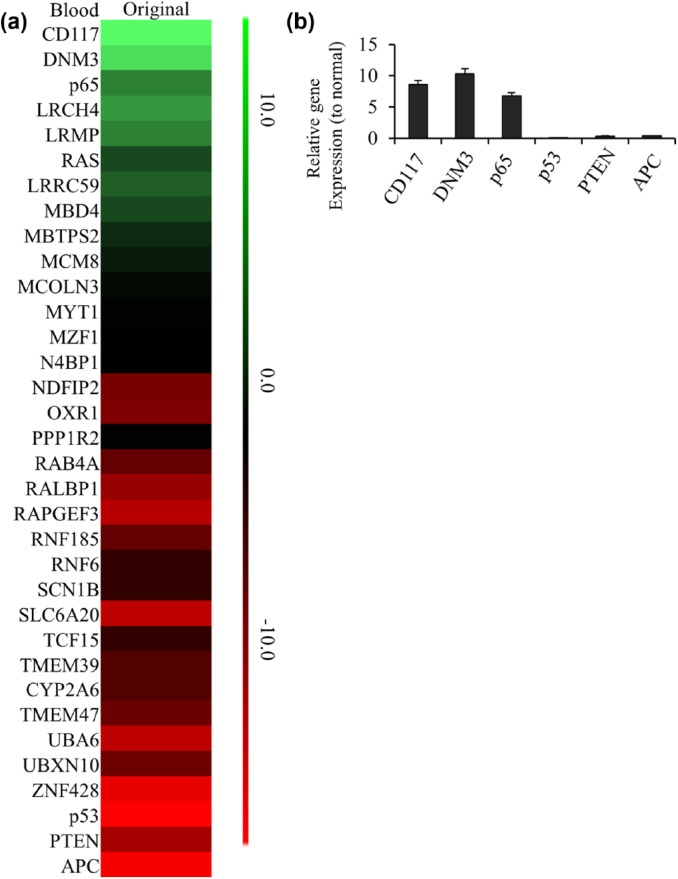
The changed gene list in blood exosome of original GBM mouse model. (a) The heatmap of 33 differentially expressed genes identified in blood exosome of original GBM mouse model. The decreased and increased genes are indicated by range of green and red intensities, respectively. (b) The top 3 of high-expressed or low-expressed gene ratios to normal tissue in blood exosome of original GBM mouse model were detected by PCR. Ct values detected by real-time PCR showed p65, DNM3, CD117, PTEN, p53 and APC had the greatest change in blood of original GBM. Relative expression values represent mean and SD from three independent experiments.
GBM, glioblastoma multiforme; PCR, polymerase chain reaction; SD, standard deviation.

