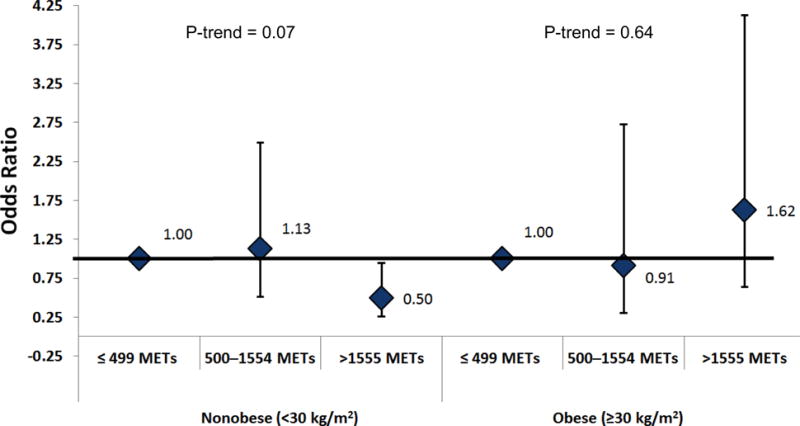
Figure 1.

Odds ratio of low or low normal testosterone by physical activity tertiles in nonobese (n=538) and obese (n=200) men 20 years or older; NHANES (1999–2004).
MET: metabolic equivalent (MET)-minutes per week. Models were stratified by the body mass index cut point for obesity (<30 kg/m2 and ≥30 kg/m2). All models were adjusted for age, race/ethnicity, smoking, cotinine, alcohol consumption, BMI, and waist circumference; ≤ 499 METs = reference group. P for interaction = 0.21
