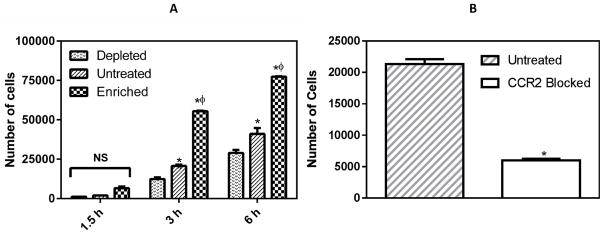
Figure 1.
Monocyte chemotaxis in response to MCP-1 gradient. (A) Number of cells transmigrated to the bottom well after 1.5h, 3h and 6h. (B) Number of cells transmigrated at 3 h in the presence of anti-CCR2 antibody (25 μg/ml). * and φ represent statistically significant difference (p< 0.05, n = 3) in comparison to depleted and untreated cells, respectively.

