
Figure 5. Effects of Rapamycin on PI3 Kinase Pathway Targets.
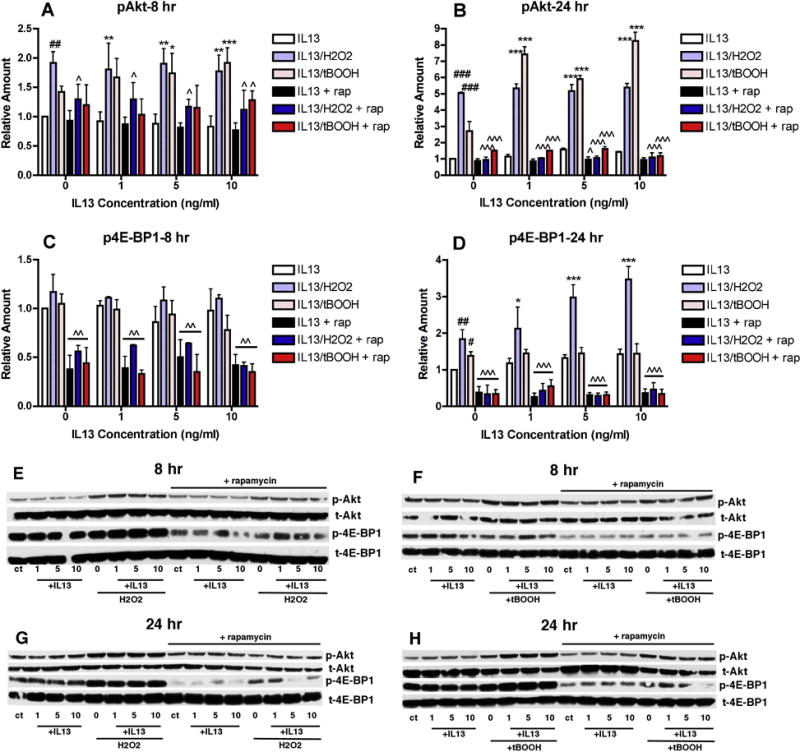
MN9D cells were untreated or treated with 1, 5 or 10 ng/ml IL-13 alone or in the presence of 80 μM H2O2 or 2.5 μM tBOOH in the absence or presence of 100 nM rapamycin as indicated for 8 or 24 hr. Cell lysates were prepared and equal amounts of protein were analyzed by SDS-PAGE and immunoblotting with antibodies to phospho and total Akt and phospho and total 4E-BP1. (A)–(D) Western blots from 3–5 independent experiments similar to the ones shown in (E)–(H) were scanned and quantified. # p < 0.05; ## p < 0.01; ### p < 0.001 relative to control. * p < 0.05; ** p < 0.01; *** p < 0.001 relative to IL-13 alone. ˆ p < 0.05; ˆˆˆ p < 0.001 relative to no rapamycin. (E)–(H) Representative Western blots. Similar results were obtained in 3–5 independent experiments.