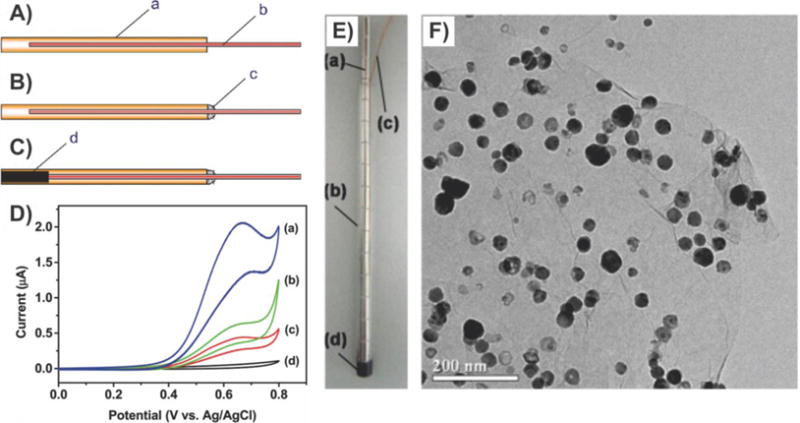
Figure 20.

Electrochemical detection of carbohydrates. (A–C) Schematics illustrating the fabrication process of a graphene–copper nanoparticle composite paste electrode. (D) Cyclic voltammograms at (a) a graphene–copper nanoparticle composite paste electrode, (b) a copper nanoparticle paste electrode, (c) a graphite–copper nanoparticle composite paste electrode, and (d) a graphene paste electrode in 75 mM NaOH aqueous solution containing 2 mM glucose. Scan rate, 50 mV/s. The content of paraffin oil in the four pastes was 25% (w/w). Panels (A)–(D) reprinted with permission from ref 150. Copyright 2012 American Chemical Society. (E) Photograph of a magnetic electrode and (F) TEM image of graphene–NiNP hybrid: (a) NdFeB magnet; (b) glass tube; (c) copper wire; and (d) graphite–epoxy composite. Panels (E) and (F) reprinted with permission from ref 151. Copyright 2013 Elsevier.
