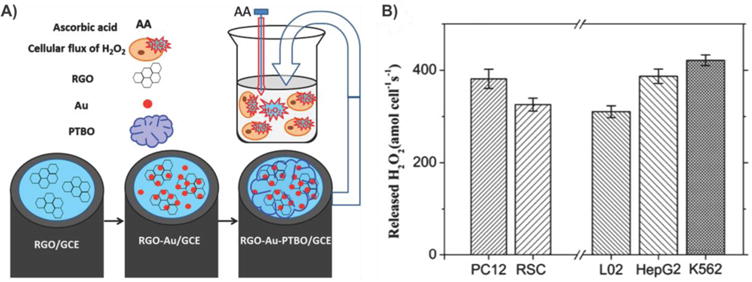
Figure 21.

Evaluating oxidative stress in tumor cells. (A) Schematic of the LBL assembly of RGO–Au–PTBO modified GCE used for detecting H2O2 efflux from cells stimulated with AA. (B) Amount of H2O2 released by PC12, RSC, L02, HepG2, and K562 cell lines stimulated by 4 μM AA. The values are expressed as means ± SD of at least three independent measurements. Reprinted with permission from ref 152. Copyright 2013 Elsevier.
