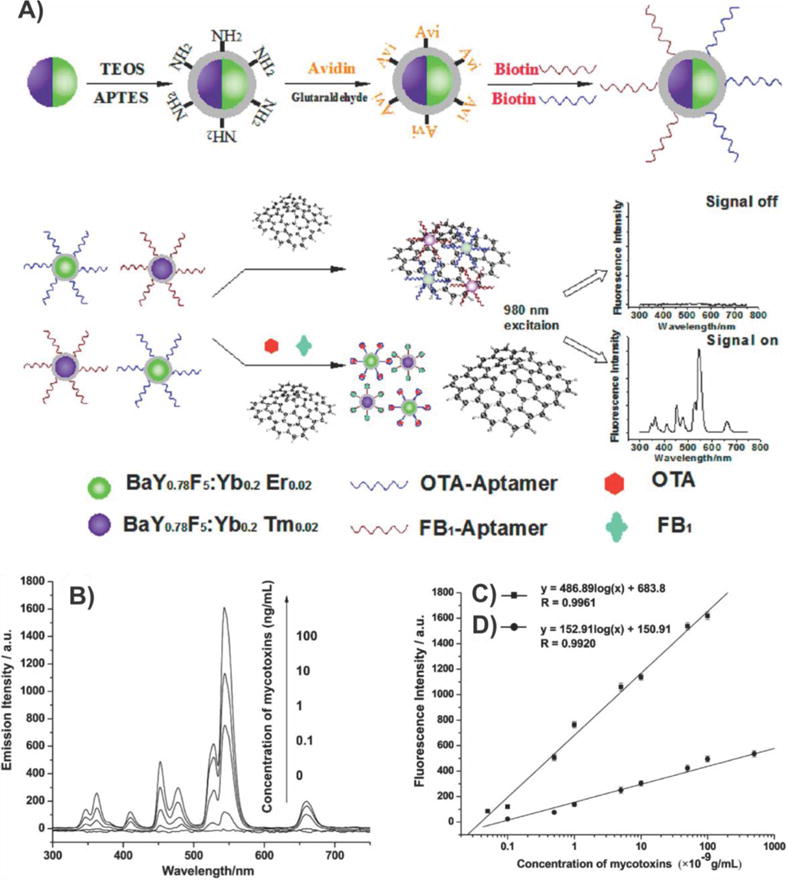
Figure 22.

Multiplexed fluorescence resonance energy transfer aptasensor. (A) Schematic illustration of the multiplexed upconversion fluorescence resonance energy transfer between aptamers-UCNPs and GO for FB1 and OTA detection. (B) Upconversion fluorescence spectra of the multiplexed UCNPs-GO FRET aptasensor in the simultaneous presence of 0–100 ng mL−1 FB1 and OTA. (C) A standard curve of the fluorescence intensity versus OTA concentration and (D) FB1 concentrations measured by this developed method. Reprinted with permission from ref 156c. Copyright 2012 American Chemical Society.
