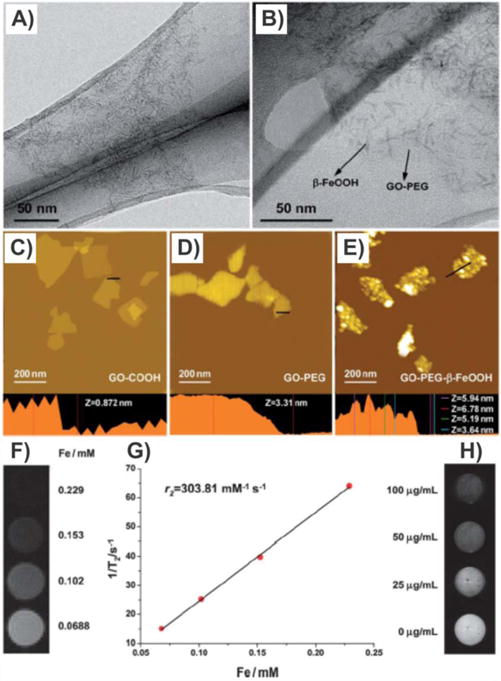
Figure 28.

In situ growth of β-FeOOH nanorods on GO for in vivo MRI and cancer therapy. (A and B) TEM images of β-FeOOH nanorods on GO. AFM images of (C) GO-COOH, (D) GO-PEG, and (E) GO-PEG-β-FeOOH. (F) T2-weighted MR images of GO-PEG-β-FeOOH. (G) Plot of 1/T2 versus Fe concentration in GO-PEG-β-FeOOH. The slope indicates the specific relaxivity (r2). (H) T2-weighted MR images of HeLa cells after 4 h incubation with different concentrations of GO-PEG-β-FeOOH. Reprinted with permission from ref 195. Copyright 2013 Royal Society of Chemistry.
