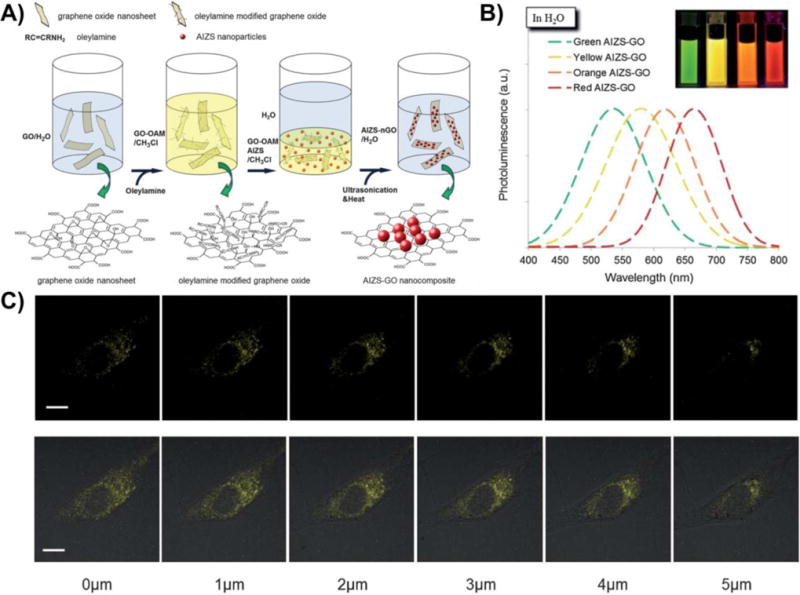
Figure 30.

GO–AIZS NP composites for cellular imaging. (A) Schematic illustration of the procedure for synthesizing fluorescent zinc-doped AgInS2 quantum dot decorated GO (AIZS–GO) nanocomposites. (B) The photoluminescence spectra of AIZS–GO nanocomposites suspended in water. (C) Confocal laser scanning microscope (CLSM) images (top row) and merged images (bottom row) of one typical NIH/3T3 cell tagged with yellow color emitting AIZS–GO–PEG nanocomposites at different cross sections (1 μm intervals). Scale bars: 10 μm. Reprinted with permission from ref 204. Copyright 2013 Royal Society of Chemistry.
