
Figure 38.
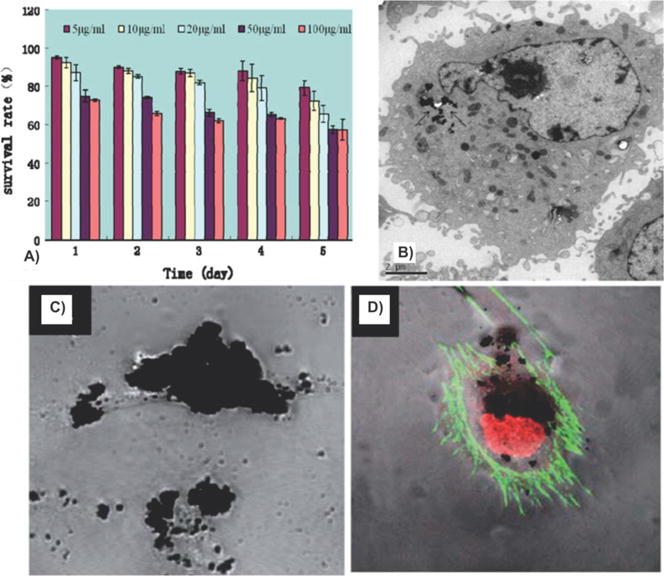
Biocompatibility of graphene materials. Effects of GO on human fibroblast cells. (A) The survival rate at different concentrations of GO and at different periods of exposure. (B) TEM picture showing the location of GO inside human fibroblast cells as indicated by the black arrows. Reprinted with permission from ref 248. Copyright 2011 Springer. (C) Differential interference contrast image showing the accumulation of pristine graphene on the plasma membrane of Vero cells. (D) Fluorescence confocal microscopy of cytoskeletal F-actin arrangement of cells treated with pristine graphene. Reprinted with permission from ref 249. Copyright 2011 Royal Society of Chemistry.