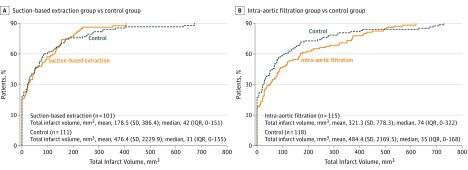
Figure 2. Distribution of Volume of Infarcted Brain Tissue by Randomization Group Observed on the Day 7 Diffusion-Weighted MRI Scan.
Panels A and B depict the cumulative distribution of observed infarct volume up to the 90th percentile for each treatment group compared with the control group. The y-axis gives the percentage of patients with an observed total infarct volume less than or equal to that of the corresponding infarct volume on the x-axis. IQR indicates interquartile range; MRI, magnetic resonance imaging.

