Figure 3.
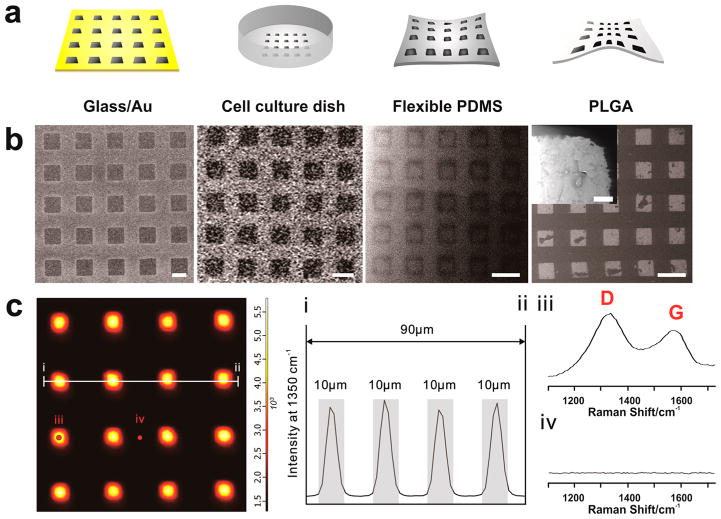
Combinatorial graphene pattern arrays on different substrates. (a) Schematic diagram representing four different types of biocompatible substrates (Au-deposited glass, TCP, flexible PDMS and poly(lactic-co-glycolic acid) (PLGA)) having NGO square patterns on its surface. (b) Helium ion microscopy (HIM) images of NGO square patterns generated on Au-deposited glass, TCP, flexible PDMS and PLGA that match with the illustrations represented in (a). Scale bar = 20 μm. Inset is the high magnification image of NGO pattern on PLGA that shows detailed features of NGO pattern. Scale bar = 500 nm. (c) Confocal Raman mapping image of NGO square pattern generated on the glass/Au substrate, using D band (1350 cm−1) of graphene oxide as an indicator for the Raman intensities. The X and Y axes were 100 μm × 100 μm. (I and ii) Intensity profile of Raman peak (D band of GO) that shows the size of NGO patterns (10 μm). Gray color represents the region that shows strong Raman peaks assigned to D band, which matches with the size of NGO pattern. Raman spectra obtained from the spot (iii) and (iv) from the Raman mapping image that proves the presence and absence of NGO based on strong D and G band. Detection time was 5 and 20 s for mapping image and Raman spectra shown in (iii) and (iv), respectively.

