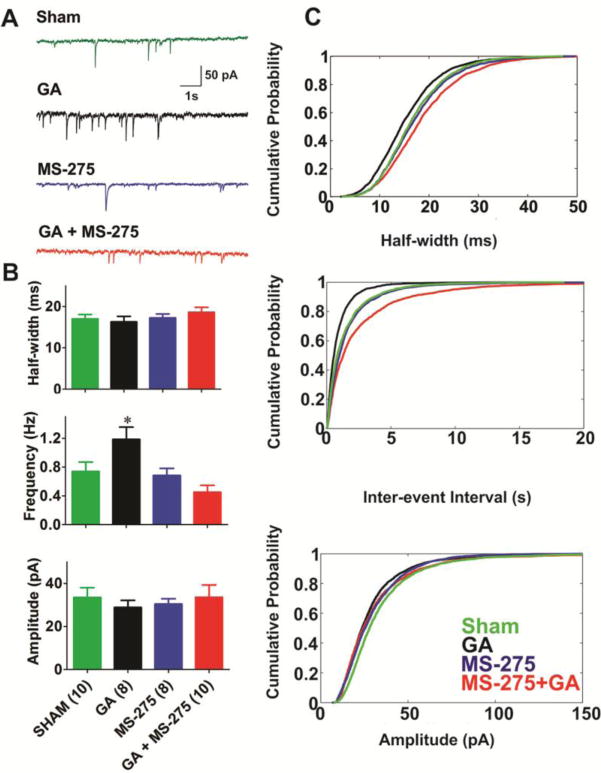
Figure 3. MS-275 completely reversed increased frequency of mIPSCs in hippocampal slice cultures exposed to the combination of 25 μg/ml of midazolam, 0.75% Iso and 70% N2O.

A: Sample of original mIPSC traces from sham (green), GA-treated (black), MS-275-treated (blue), and GA+MS-275-treated hippocampal neurons. B: Graphs representing the effects of GA, MS-275, and their combination on half-width, frequency and amplitude of mIPSCs. Note that the application of MS-275 (10 μM) reversed the GA-induced increase in mIPSC frequency. Number of neurons in each group is indicated in parenthesis bellow the X axis of the bottom panel of this figure. C: Plots describing the cumulative distribution functions (CDFs) of average mIPSC events in four treatment groups demonstrate very little change in the half-width and amplitude (upper and lower panel), as opposed to frequency (middle panel) of events. Number of events in each cohort is as follows, sham (green lines): 3910; GA (black lines): 4227; MS-275 (blue lines): 3233; MS-275+GA (red lines): 2247.
