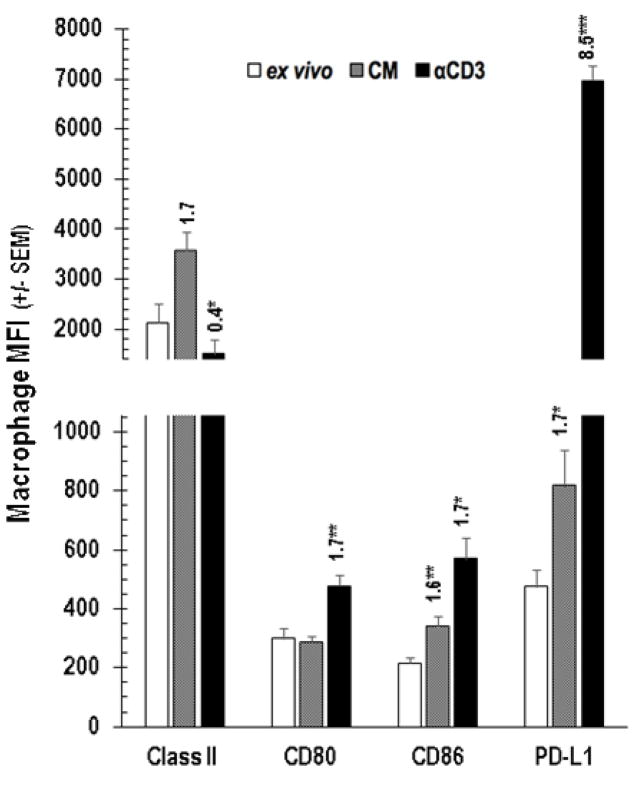
Figure 3.
PerC Mϕ expression level of cognate T cell ligands. Cells were analyzed ex vivo or after 48 hrs with (αCD3) or without (CM) stimulation. The number above each histogram is the MFI index, which is the experimental MFI divided by the appropriate control MFI (CM MFI / ex vivo MFI, αCD3 MFI / CM MFI). Histograms depict averages +/− SEM of 5–8 experiments.

