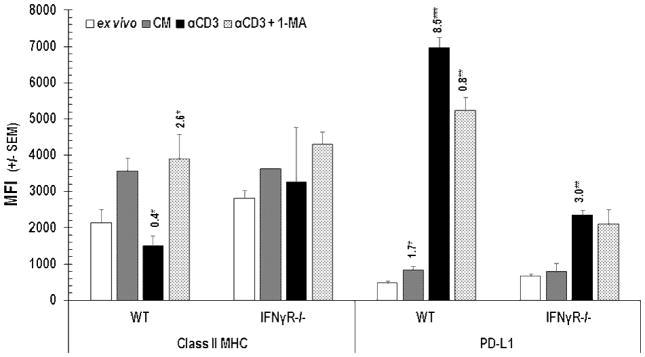
Figure 5.
Class II MHC and PD-L1 expression by PerC Mϕs. Cells were analyzed ex vivo or after 48 hrs in unstimulated (CM) or stimulated (αCD3) cultures +/− the iNOS inhibitor 1-MA. MFI indices above histograms as described in Figure 4. Data represent the average +/− SEM of 3 or more experiments.

