
Figure 1. Rescaling of task activations after sleep.
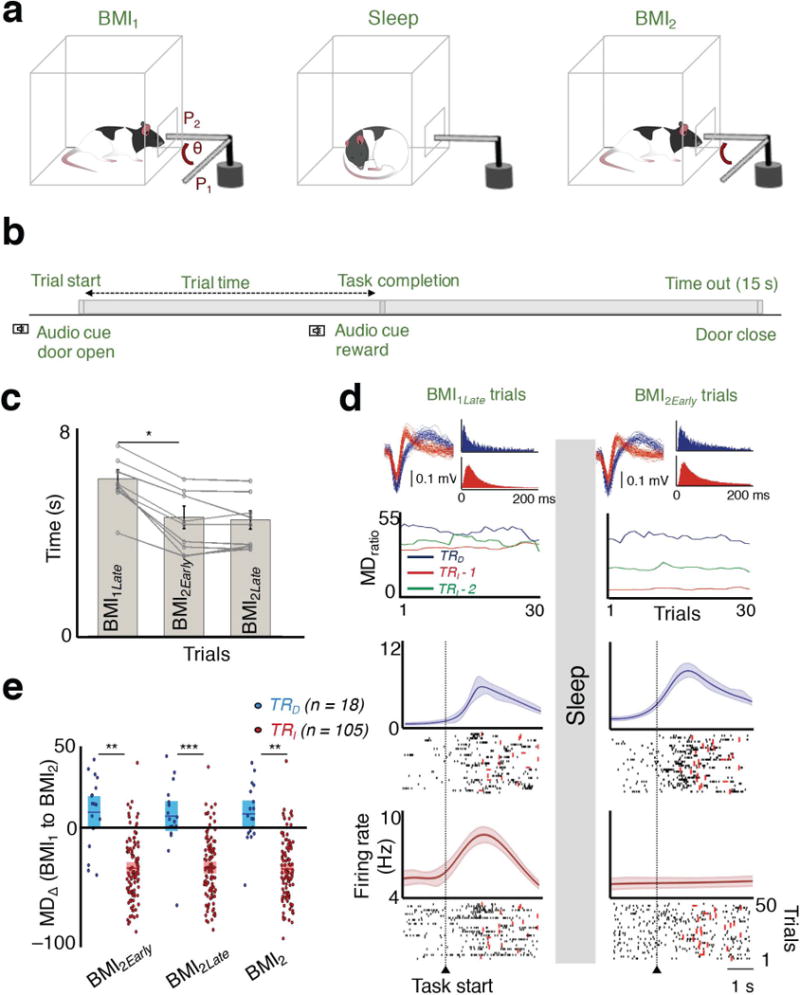
a, The practice sessions were separated by a block of sleep. Rats learned direct neural control of a feeding tube (θ = angular position). Successful trials required movement from P1 to P2 within 15 s. b, A typical trial structure is depicted. c, Comparison of trial times. A significant reduction in completion time was found between BMI1Late to BMI2Early (n = 10 sessions; paired t test, t9 = 7.62, *P < 10−4). d, At the top are the waveforms and inter-spike interval histograms of the neurons analyzed below (color-coded). Plot below shows the trend in the modulation depth ratio (MDratio) during BMI performance for three neurons before and after sleep. Another neuron whose waveform is not shown is depicted in green. Below are the peri–event histograms from BMI1Late and BMI2Early trials, respectively for the TRD and TRI neurons (in same color convention). Thick line represents mean; shaded area is the jackknife error. Below the PETHs are representative spike rasters from multiple trials. Red dot indicates task completion time for each trial. e, Average modulation depth change (MD∆) between BMI1 and BMI2 (mean in solid line ± s.e.m. in box; unpaired t tests; BMI1 and BMI2Early t121 = 6.79, **P < 10−9; BMI1 and BMI2Late t121 = 6.31, ***P < 10−8; BMI1 and BMI2 t121 = 6.96, **P < 10−9).