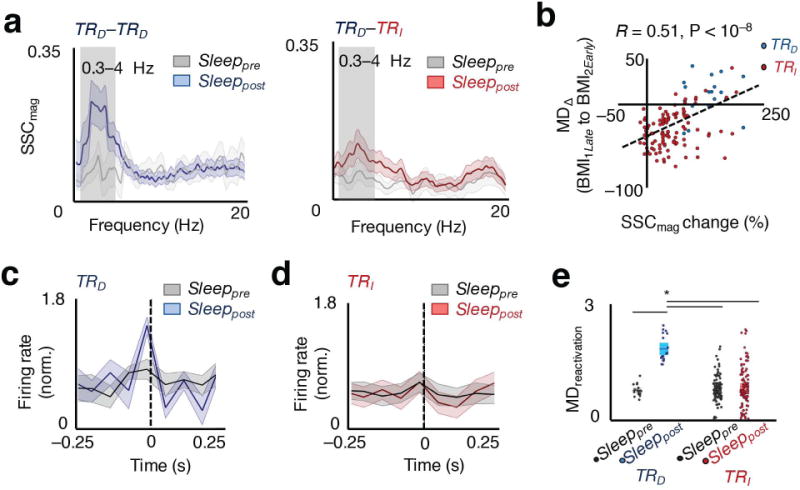
Figure 2. Changes in functional connectivity of direct neuronal pairs and reactivation microstructure.

a, Example plot of SSC as a function of frequency during sleep prior to (Sleeppre) and after (Sleeppost for TRD – TRD; red for TRD – TRI pairs) skill acquisition. The lighter band is the jackknife error. The box highlights the 0.3 – 4 Hz band. b, Relationship between SSC change before and after learning, and change in task-related modulation after sleep, MDΔ (BMI1Late to BMI2Early), spearman correlation, r(123) = 0.51, P < 10−8. c, Average modulation depth during reactivations (MDreactivation, i.e. ratio of peak to tails) of TRD neurons from Sleeppre to Sleeppost. d, MDreactivation of TRI neurons from Sleeppre to Sleeppost. e, Average modulation depth during Sleeppre to Sleeppost reactivations for TRD and TRI neurons (mean in solid line ± s.e.m. in box, one-way ANOVA, F3,242 = 34.28, P < 10−17; significant post hoc t tests, *P < 0.05).
