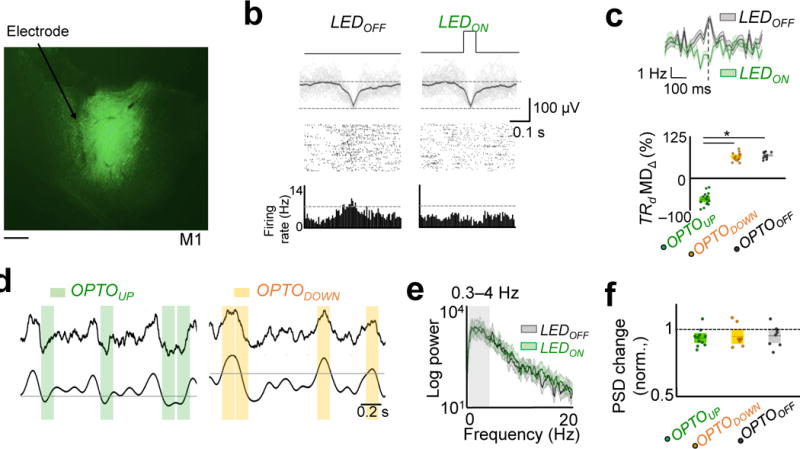
Figure 5. Optogenetic inhibition of neural activity during sleep.

a, Fluorescence image of a coronal brain section showing neurons expressing Jaws (green) in M1. Scale bar is 500 μm. b, UP state triggered LED inhibition of a TRD cell in Sleeppost as compared to the activity of same cell in Sleeppre without stimulation. Rasters are shown along with raw traces of the local-field potential (LFPs) based on threshold crossing of the LFP. Dark line is the mean LFP. Bottom-most row shows histogram of firing activity. c, Top: Average modulation depth (MD) of a TRD cell in a representative OPTOUP experiment. Bottom: Average modulation depth (MD) of TRD cells around slow-oscillations in OPTOUP, OPTODOWN, and OPTOOFF experiments (mean in solid line ± s.e.m. in box, one-way ANOVA, F2,41 = 425.75, P < 10−27; significant post hoc t tests, *P < 0.05). d, Examples of the raw and filtered (0.3–4 Hz) traces and the stimulation period for respective OPTOUP and OPTODOWN experiments. e, Power spectrum of LFP from Sleeppre and Sleeppost in an OPTOUP experiments. The lighter band is the jackknife error. f, Power spectral changes (in 0.3 – 4 Hz) for OPTOUP, OPTODOWN, and OPTOOFF experiments (one-way ANOVA, F2,27 = 0.13, P = 0.87).
