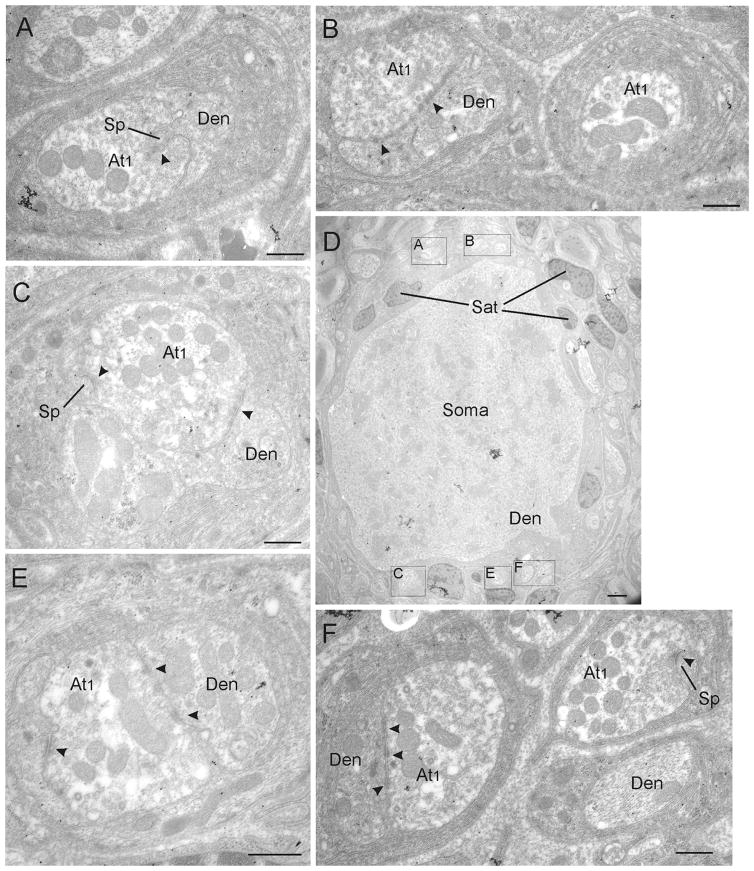
FIGURE 3.
Ultrastructure of cells receiving At1 inputs. Electron microscopic images of GABA-negative terminals from a CG section that was immunogold-labeled for GABA. The low magnification electron micrograph of a typical monkey CG neuron (D) is used to indicate the location of the higher magnification samples of At1 terminals (boxes) in the perisomatic neuropil of this neuron. Arrowheads indicate synaptic contacts. Note that all At1 terminals are GABA-negative (A–F). Abbreviations: At1 = axon terminal type 1, Den = dendrite, Sat = satellite cell, Sp = spine. Scale bar = 0.5 μm in A–C, E–F; 2.0 μm in D

