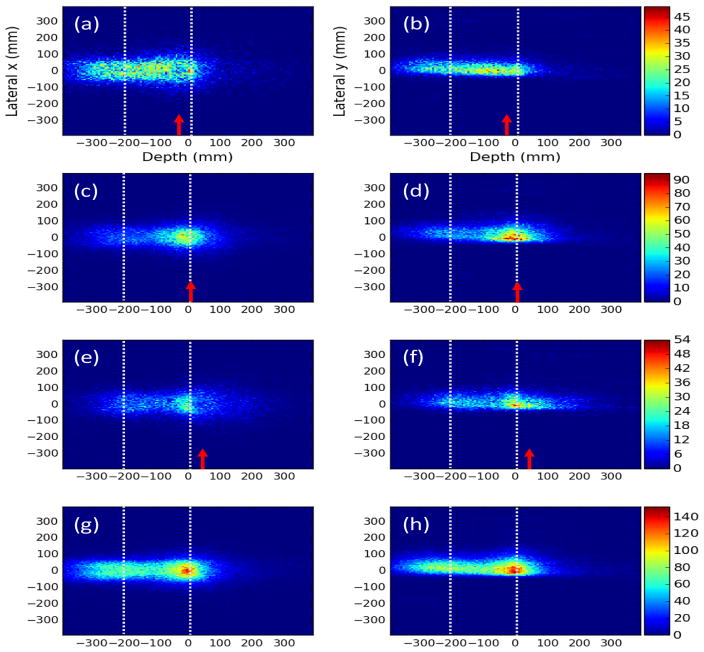
Figure 4.
XZ projection images for the CC placed at (a) P3, (c) P2, and (e) P1 as indicated by red arrows and for the (g) data measured at each position combined for D2C filtered data measured during delivery of 2 Gy with a 180 MeV pencil beam. YZ projection images are shown for (b) P3, (d) P2, and (f) P1 as indicated by red arrows and the (h) data measured at each position combined. Dashed gray lines represents the entrance of the phantom (−210 mm) and the depth of the distal 90% range (3 mm) of the proton pencil beam.

