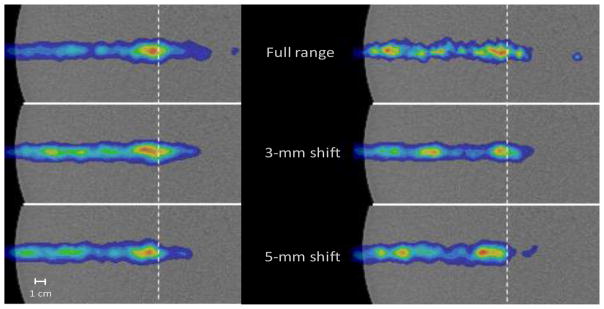
Figure 7.
Close up of the central slice PG images (XZ-plane, y = 0 mm) for the delivery of 6.29 × 10⁸ protons (left column) and 1 ×10⁸ protons (right column) for the full range 120 MeV pencil beam, 3 mm range shifted, and 5 mm range shifted pencil beams, each normalized to its respective maximum value. The gray dashed lines represent the depth of the distal 90% of the full range pencil beam.

