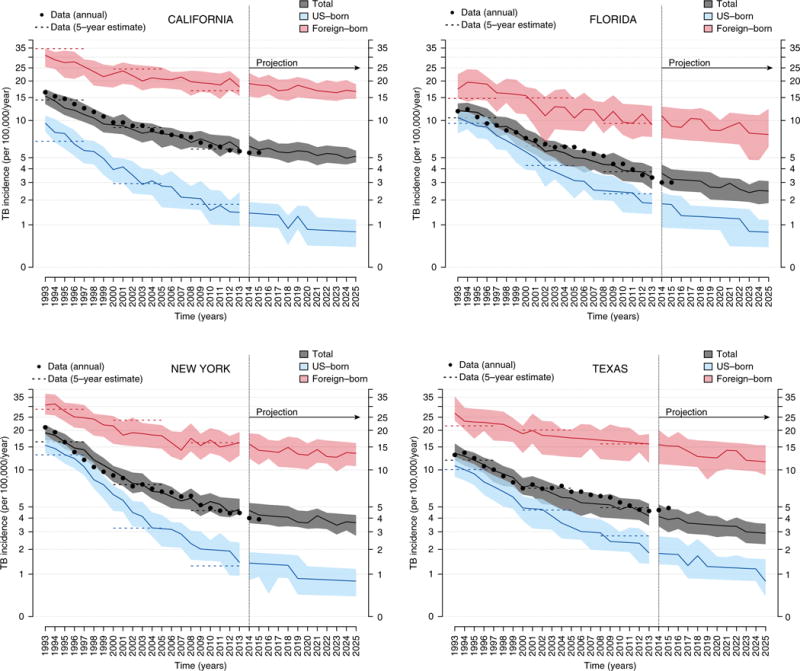
Figure 4.

Model-based simulations and projections of trends in tuberculosis (TB) incidence in four states. Shown are model-based simulations in trends of TB incidence between 1993 and 2013 followed by projections up to 2025 for each of four states: California (top left), Florida (top right), New York (bottom left), and Texas (bottom right). The simulations are based on the state-specific maximum likelihood estimate (MLE) models, and projections are the continuation of model simulations (with continued decline in the transmission rates at the post-1993 estimate). For each panel, shown are medians (solid lines) and interquartile range (shaded area) of 100 replicate simulations of the MLE models. Shown in black dots are data for annual TB incidence between 1993 and 2015. Shown in dashed lines is the estimated mean annual TB incidence (based on data) in each state in three 5-year periods of 1993 to 1997, 2001 to 2005, and 2009 to 2013. The foreign-born population is represented in pink, U.S.-born population in light blue, and the total population in gray.
