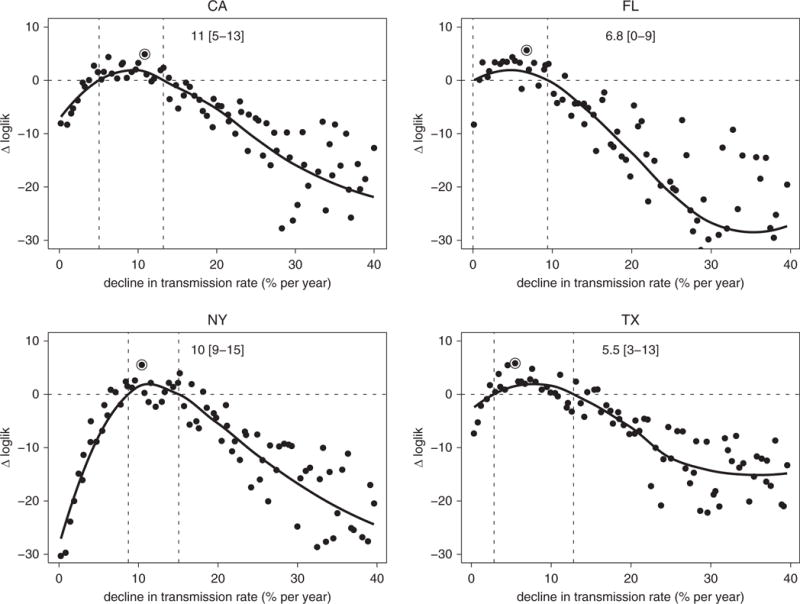
Figure 5.

Estimated annual declines in tuberculosis transmission rates. Likelihood profiles (shown in a log scale as a difference with Δloglik = 0 representing the estimated 95% threshold) for the annual rates of decline in the transmission rate (in %/yr) in the four states: California (top left), Florida (top right), New York (bottom left), and Texas (bottom right). Each point on the profile represents the log-likelihood of each estimate (on the y-axis) maximized over all parameters with the decline in transmission held at the level on the x-axis. The point marked with an open circle shows the maximum likelihood estimate (MLE), and the two dashed vertical lines show the estimated 95% confidence interval (smoothed estimate of log-likelihood no lower than 1.92 less than the MLE). loglik = log-likelihood.
