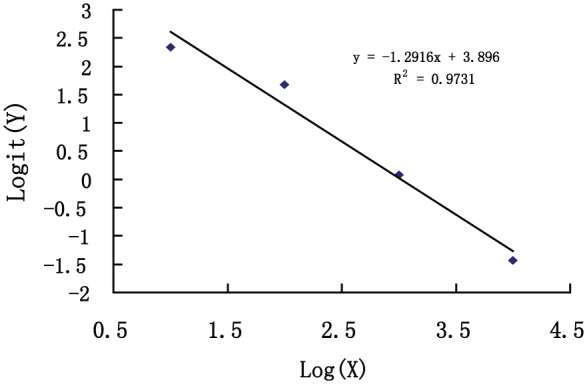
Figure 3.

Compound W homogeneous time-resolved fluorescence immunoassay standard curve (X, concentration of standards [pg/mL]; Y, signal counts [counts per second, CPS]).

Compound W homogeneous time-resolved fluorescence immunoassay standard curve (X, concentration of standards [pg/mL]; Y, signal counts [counts per second, CPS]).