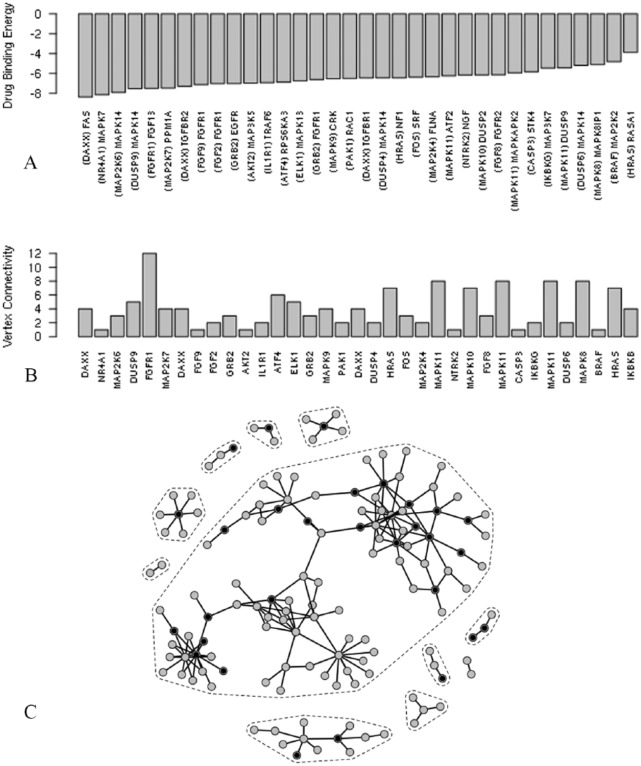
Figure 4.
(A) Drug-protein binding energies (in kJ mol−1) that underlie the disappearance of gene-gene interactions from the resistive sample network compared with the sensitive sample network. (A) Proteins targeted by the drug are indicated in parentheses and (B) their connectivity indices in the resistive sample network. (C) Targeted genes are superposed in black on the resistive sample network.

