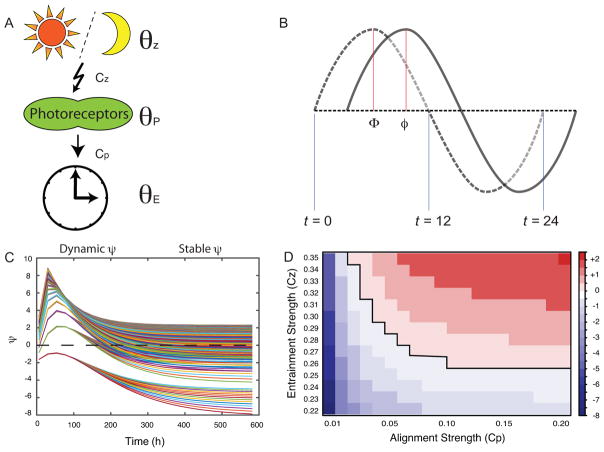
Figure 3.
Mathematical model. A. A cartoon describing the mathematical parameters in a biological system. The zeitgeber (θz) entrains photosensitive protein (θP), and the time derivative for the state of this protein ( ) is a function of the entrainment strength (Cz). Entrainment is active during a specific time of day, hence the photoreaction arrow. The endogenous clock (θE) is influenced by the state of the photosensitive protein (θP), and the time derivative of the clock ( ) is a function of the alignment strength (CP). The clock constantly aligns with the photosensitive protein, hence the straight arrow. B. A plot showing the zeitgeber signal and the endogenous clock signal. The dotted wave line represents zeitgeber signal (θz). The solid wave line represents endogenous signal (θE). The phase of entrainment (ψ) between the two signals is calculated as, ψ = Φ − φ. The blue lines indicate reference times of day, i.e. θz = 0 ⇔ t ≡ 0 (mod 24), θz = π ⇔ t ≡ 12 (mod 24). C. A plot showing how ψ gradually changes over time (Dynamic ψ) and eventually stabilizes after several days (Stable ψ). D. A heatmap of the simulations in panel C showing the values of the entrainment strength (Cz) and alignment strength (CP) which produce various stable ψs over time.

