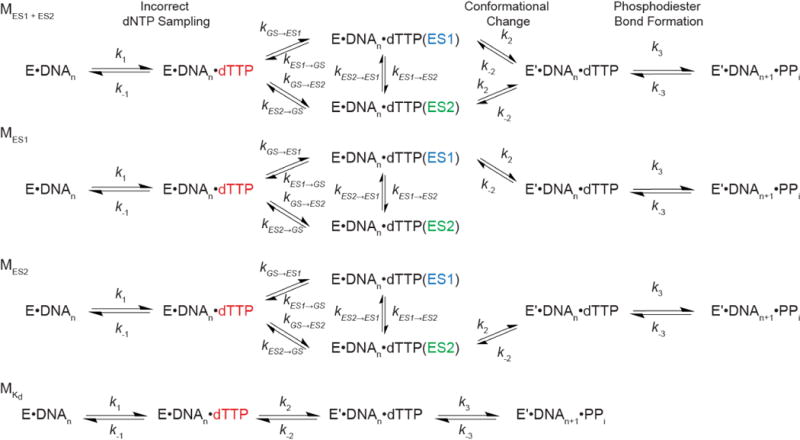
Extended Data Figure 8. Benchmarking kinetic simulations of misincorporation.

a, Comparison of kpol and Kd values for correct incorporation measured experimentally for human DNA polymerase ε with values computed based on pre-steady state simulations using the microscopic rate constants provided in ref. 39. Error bars reflect fitting uncertainty as previously published39. b, Robustness of calculated kpol values for human DNA polymerase ε when varying rate constants (forward rate constant: blue; and reverse rate constant: orange) for steps other than tautomerization/ionization by 2-fold (n = 200 independent simulations in which rate constants were randomly varied within 2-fold). As expected, the only rate constant with a substantial effect on the reported kpol values was the rate limiting k2 conformational change step (middle).
