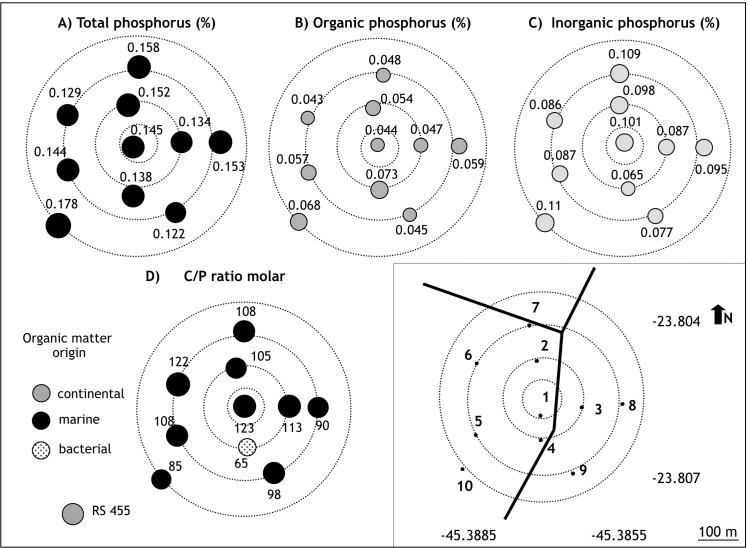
Fig 7. Concentrations of total phosphorus (%), total organic phosphorus %), total inorganic phosphorus (%), C/OP ratio (molar) of TEBAR (S1 Appendix).
Different infilling and colors of the symbols represent different ranges of values. RF: reference station.

