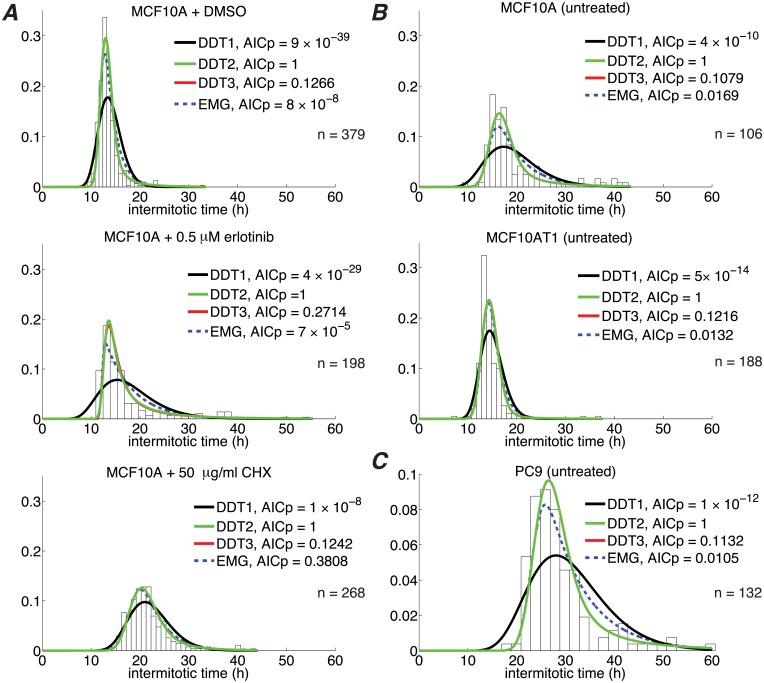
Fig 4. A two-checkpoint drift-diffusion+threshold (DDT2) model best describes IMT variability under numerous conditions.
(A), (B), and (C) correspond to independent experiments (with slightly different culture conditions; see “Cell culture”). Note that in most cases the DDT3 curve is obscured by the DDT2 curve. n: number of experimental IMT measurements.

