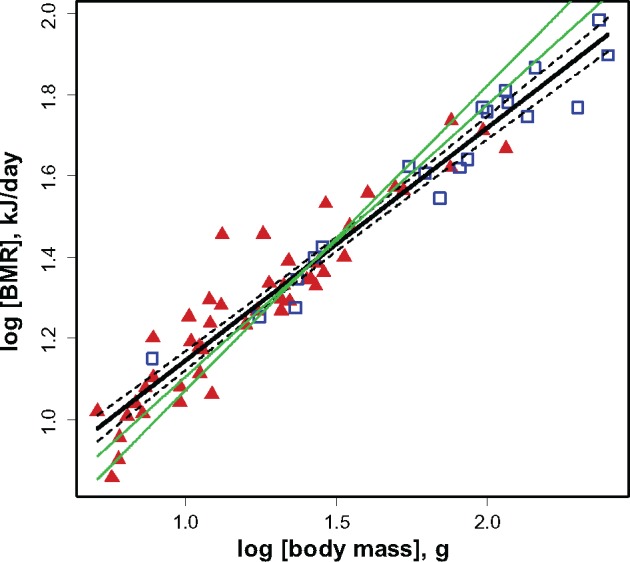
Figure 1.

The relationship between BMR and body mass in tropical birds of Southern Vietnam (black thick solid line). Red solid triangles indicate passerines; blue open squares indicate non-passerines. Green thin solid lines indicate theoretical slopes b = 0.75 (Kleiber’s law) and b = 0.67 (Rubner’s rule). Black thin dashed lines indicate 95% confidence interval of the regression.
