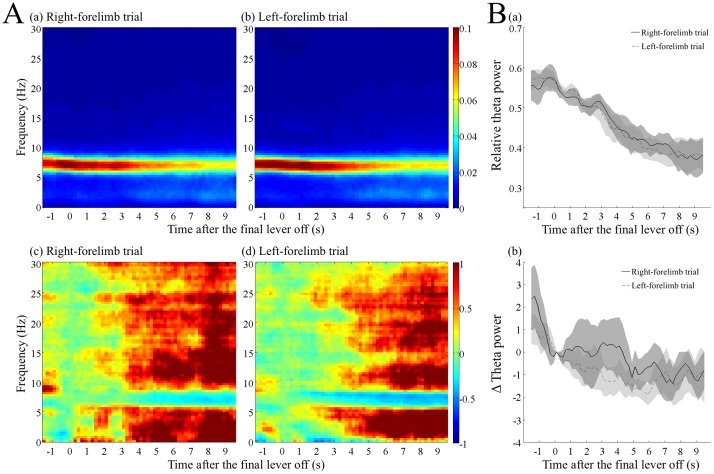
Fig 5. Decrease in the relative and absolute theta power after the termination of multiple lever pressing in the right- and left-forelimb trials.
(A) Dynamic power spectra after the final lever off, with the right (a, c) or left (b, d) forelimb in correct trials. The parameters used for the analysis were the same as in Fig 3. The relative power divided by the total power of 1–30 Hz (a, b) and the absolute power subtracted and normalized by that at the time of lever off (c, d), were calculated for each frequency. The times before the final lever off are indicated as negative values. (B) Decrease in the relative (a) and normalized absolute (b) power of the theta frequency band (6–9 Hz). The black and dotted lines indicate the data averaged over the right- and left-forelimb trials in each rat, respectively, and then over the rats. The shaded areas associated with the lines are the standard error of the mean.

