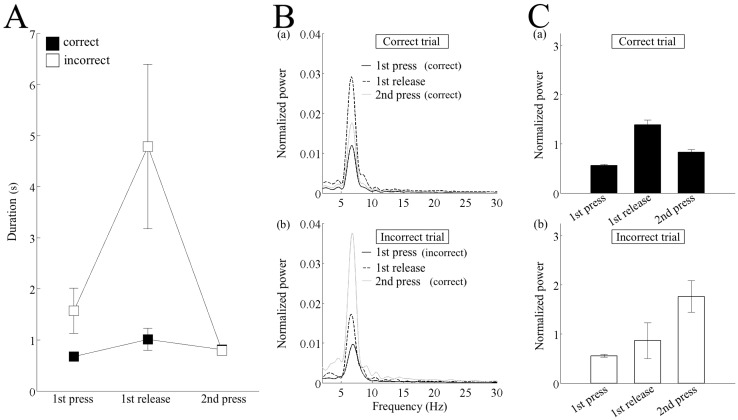
Fig 6. Differences between the correct and incorrect trials during the first and the second lever presses.
(A) Duration of the time between the first lever-on and first lever-off (1st press), between the first lever-off and second lever-on (1st release), and between the second lever-on and second lever-off (2nd press). The data were averaged over the trial type in each rat and then over all the rats. (B) Absolute power spectral density normalized by the total power of the first press (see the Methods for details) in the correct (a) and incorrect trials (b). The spectrum was averaged over the trial type in each rat, and then over all the rats. (C) Normalized power of theta frequency band (6–9 Hz) in the correct (a) and incorrect trials (b). The error-bars indicate the standard error of the mean.

