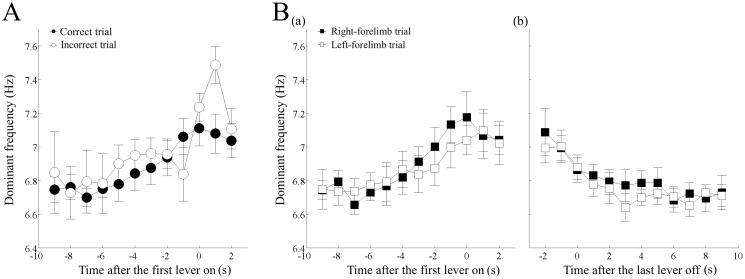
Fig 7. Change in the theta frequency before the first lever press and after the last lever release.
(A) Increase in the dominant frequency of theta oscillation before the first lever press in the correct and incorrect trials. The filled and open circles indicate the data averaged over the correct and incorrect trials in each rat, respectively, and then over all the rats. (B) Increase in the dominant frequency of theta oscillation before the first lever press (a) and decrease after the final lever off (b) in the right and left forelimb trials. The filled and open squares indicate the data averaged over the right and left trials in each rat, respectively, and then over all the rats. The error-bars indicate the standard error of the mean.

