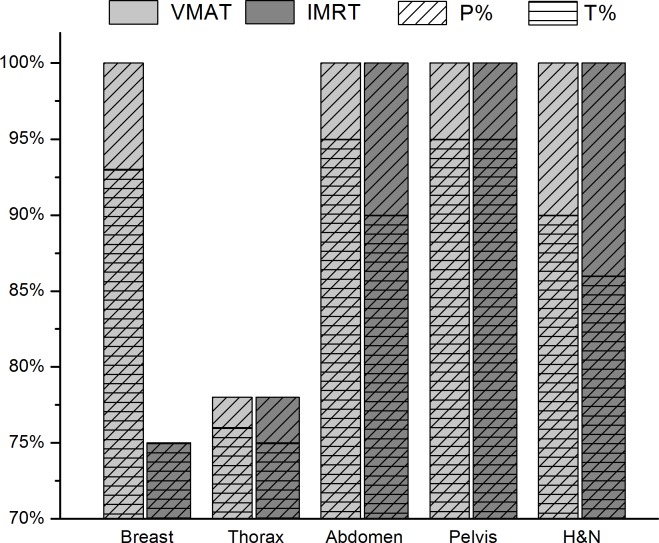
Fig 3. Comparison of the γ-analysis results for IMRT and VMAT treatments.
The percentage of patients P% (diagonal lines) and the percentage of tests T% (horizontal lines) with gamma indices within tolerance levels are reported for all the treatment sites analysed in this work (breast, thorax, abdomen, pelvis, H&N). The VMAT and IMRT treatments are indicated using light and dark grey colours, respectively.

