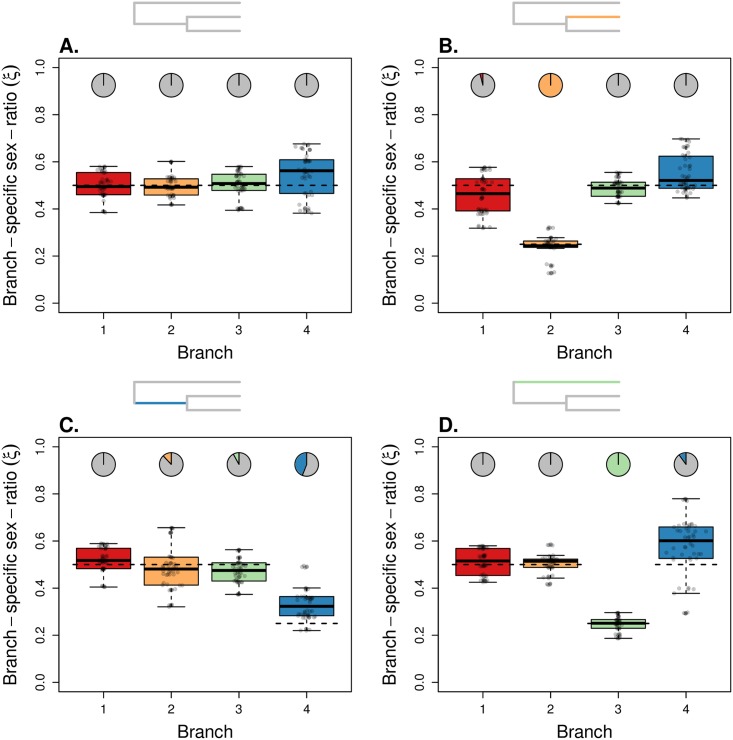
Fig 2. Performance of the model for estimating branch-specific sex ratios.
All histories represented from A to D share the same topology ((1,2),3) but differ with respect to the simulated ESR. The root population was made of 50,000 males and 50,000 females, and each branch in the topology corresponds to a population made of 500 males and 500 females (A). In (B) branch 2 was made of 250 females and 750 males (ξ2 = 0.25); in (C) branch 4 was made of 250 females and 750 males (ξ4 = 0.25); in (D) branch 3 was made of 250 females and 750 males (ξ3 = 0.25). Inset trees indicate which branch was simulated with a biased sex ratio. The two successive splits occurred 200 and 400 generations before present time. The mutation rate was fixed at μ = 5 × 10⁻⁷. 50 females per population were sampled for each dataset. We analyzed 50 replicate simulated datasets for each scenario, with 5,000 autosomal SNPs and 5,000 X-linked SNPs. The boxplots summarize the distributions of the 50 posterior means of ξi for each of the four branches. The horizontal dashed segments indicate the true (simulated) values of ξi. The pie-charts indicate the fraction of significant support values (S < 0.01), against the hypothesis ξ = 0.5 (see Eq 4).

