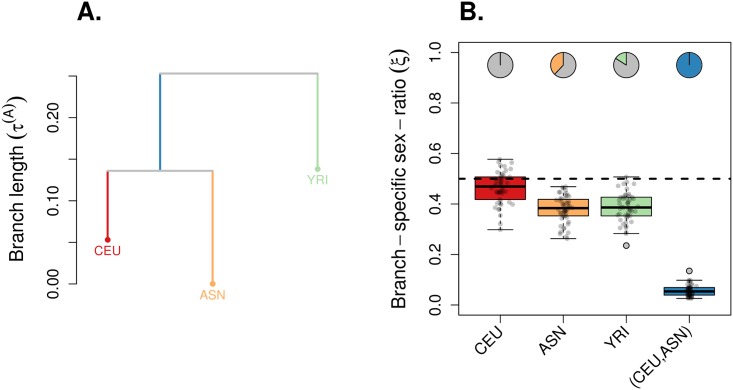
Fig 6. Application example on human (HapMap) data.
We re-analyzed the dataset from Keinan et al. [19, 42], with genotypes from European American individuals from Utah, USA (CEU), Asian individuals grouping Han Chinese from Beijing and Japanese from Tokyo (ASN) and Yoruba individuals from Ibadan, Nigeria (YRI) (see the Materials and methods section). The data consisted of 340,909 autosomal SNPs and 12,737 X-linked SNPs. For both genetic systems, we randomly subsampled 50 pseudo-replicated datasets from the full data, each made of 5,000 autosomal SNPs and 5,000 X-linked SNPs. We ran KimTree conditionally on the ((CEU,ASN),YRI) topology, represented in (A) with branch lengths estimates corresponding to the posterior means of . (B) The boxplots summarize the distributions of the posterior means of the ESR for each branch in the tree, for the 50 pseudo-replicated datasets. The dotted line indicates the expectation for a balanced ESR (ξi = 0.5). The pie-charts indicate the fraction of significant support values (S < 0.01) against the hypothesis ξ = 0.5 (see Eq 4).

